

FanGraphs Members can download any of our stats over any time frame. One of my favorite ways to use the download feature is to compare information over unique time frames. For today’s example, I’ll compare the first- and second-half fastball traits of a few Cardinals starting pitchers.
I’m going to show an example comparing two time frames for just one team, but I usually use multiple time frames (e.g. previous two seasons, first half, last month) for hundreds of pitchers. And while this comparison is especially helpful to fantasy players, anyone can use the procedure for their player analysis. One key in analyzing players, especially pitchers, is selecting unique time frames. Most people will compare first- and second-half stats, but I’ve found hidden gems by using three to eight week intervals. No site provides odd intervals in their default time frames, like the first four months to the last two, or the season divided into quarters. These data downloads help facilitate that sort of analysis. Again, the key is to find breakouts that others might not have identified.
Here is how to compare the 2023 fastball stats of this season’s Cardinals starters. And remember, this can be done with any group of pitchers and stats.
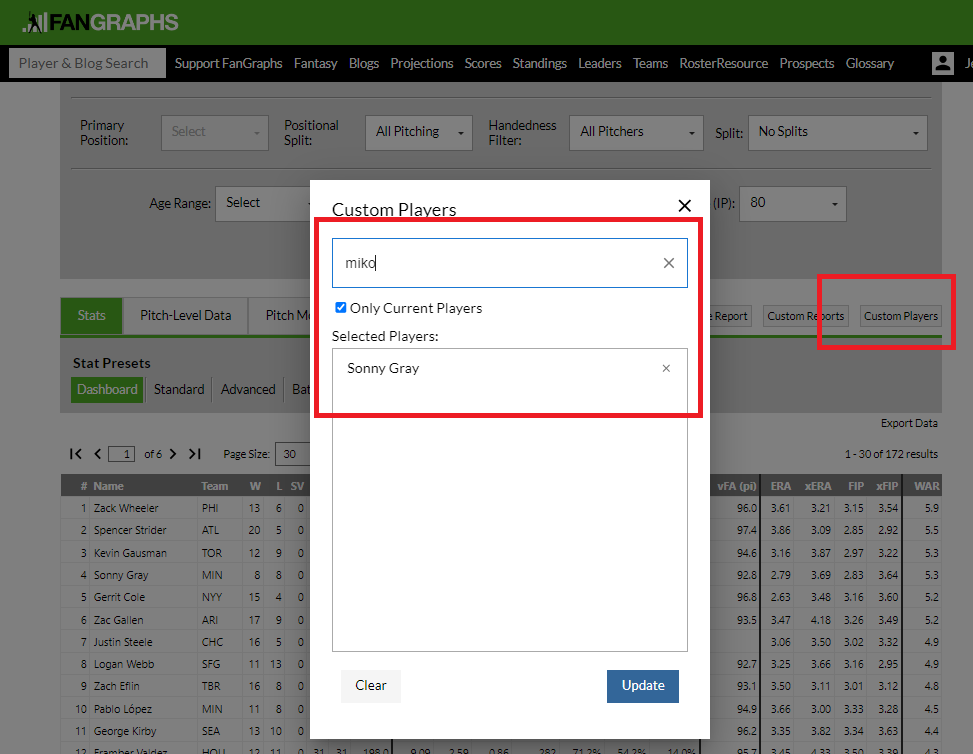
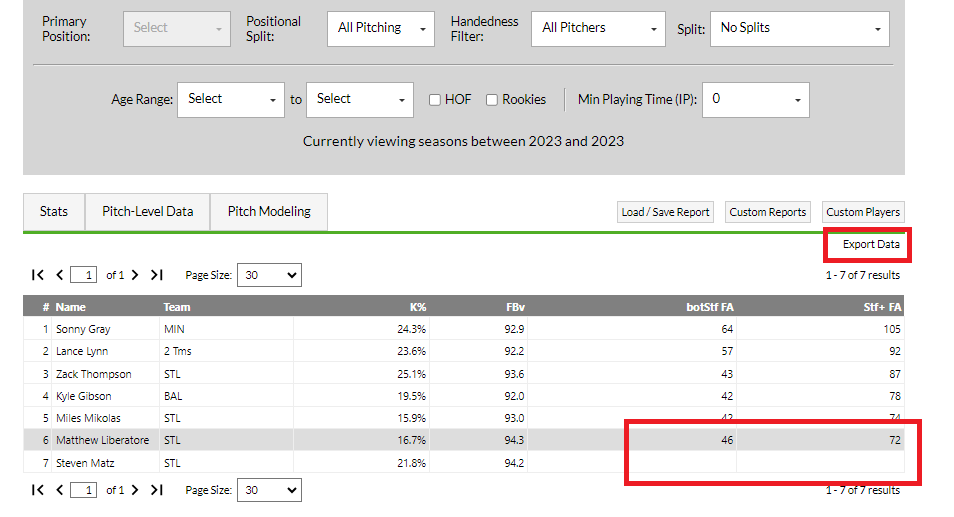
Step 1. Go to the 2023 pitching leaderboard and select “Custom Players.” Add the players.
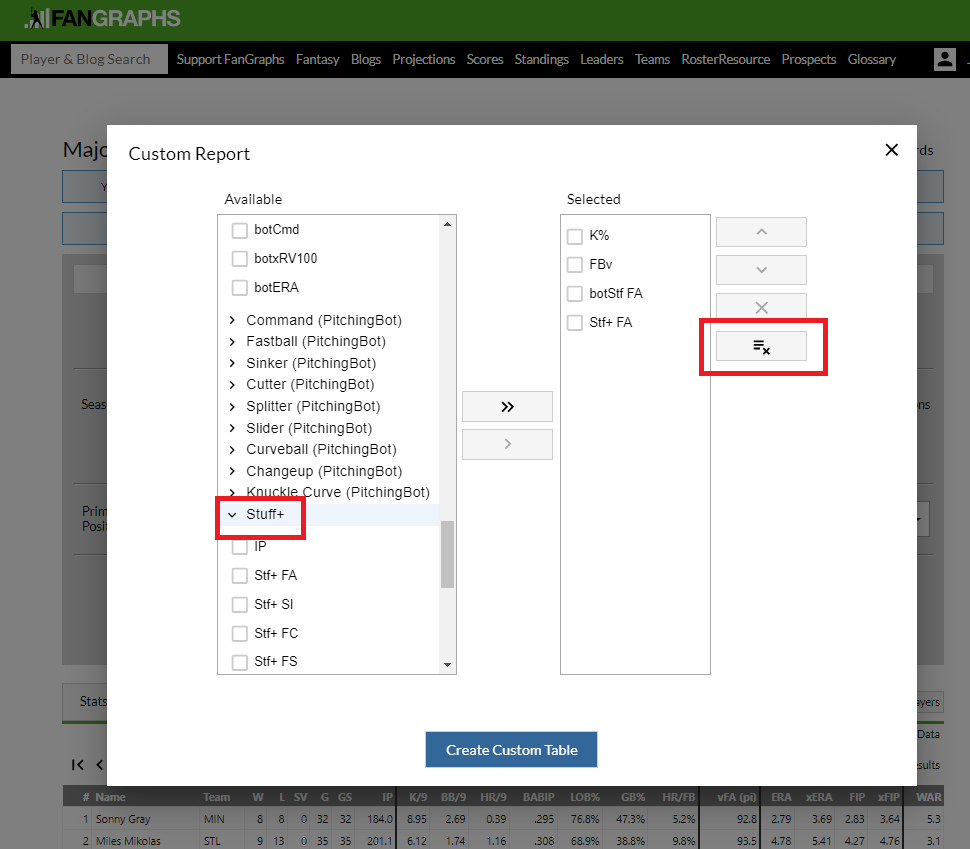
Step 2. Pick the stats you want to use. I’m using strikeout rate, fastball velocity, bot fastball stuff, and fastball Stuff+.
Step 3. Pick your desired time frame and export the information. In this example, first- and second-half stats are used, but remember, the custom date range feature allows you to select other time frames.
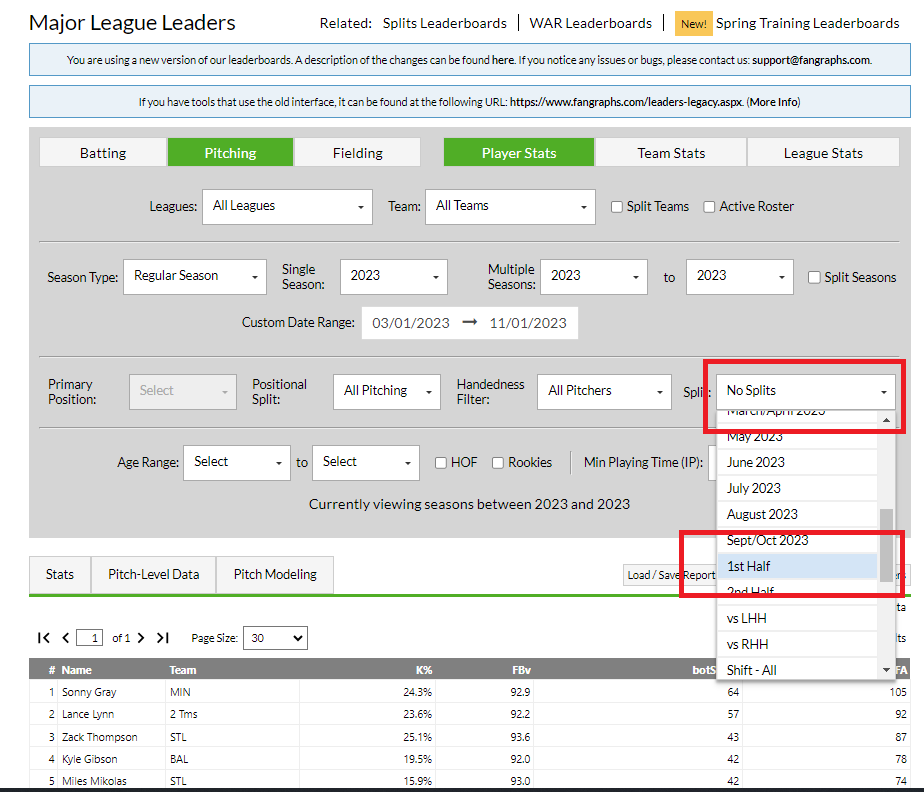
Note: Some information may be missing for some players, especially if they missed time in the minors or because of injury. In this instance, Steven Matz doesn’t throw a four-seam fastball, just a sinker.
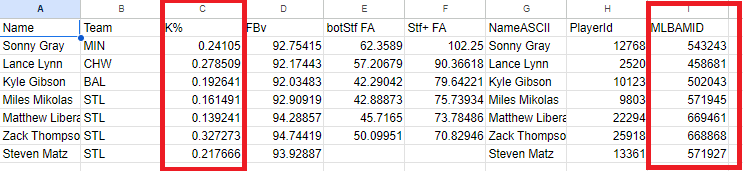
Step 4. Import the downloads into a single spreadsheet. In this example, I imported them into Google Sheets to share the information.
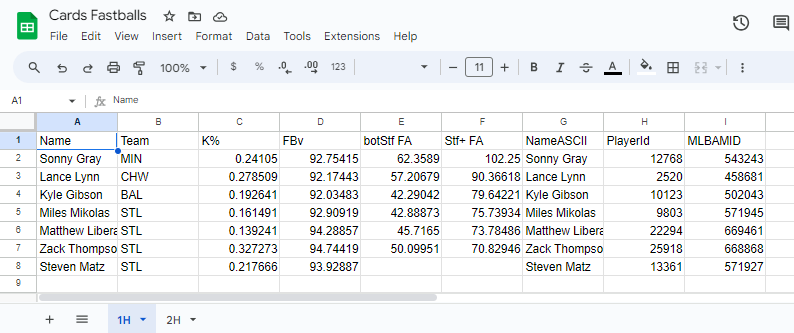
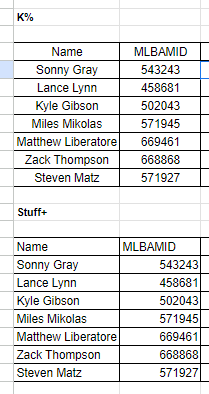
Step 5. Put the names and stats you want to compare into separate sheets. For now, include one of the IDs. They can be hidden in a future step.
Step 6. Link the various players and time frames. This is the “hard” step, but it needs to be mastered. The easiest way to pull the information is with the XLOOKUP command. The command is intuitive and only has three inputs. The first input is a value to match, normally a player ID (FG or MLBAMID) or name.
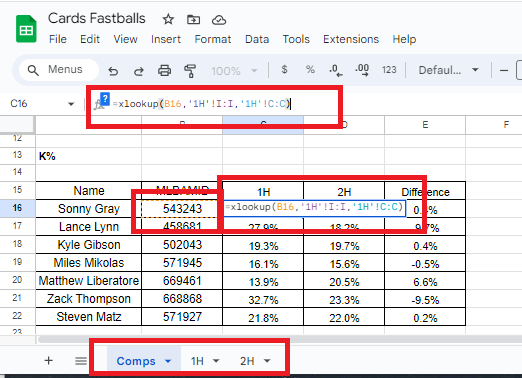
The second value is from another column that contains the same ID/name in a sheet that includes the desired stats. In this instance, Column I in Sheet 1H has the MLBAMID. The third value is the column, C in this instance, with the desired corresponding stat.
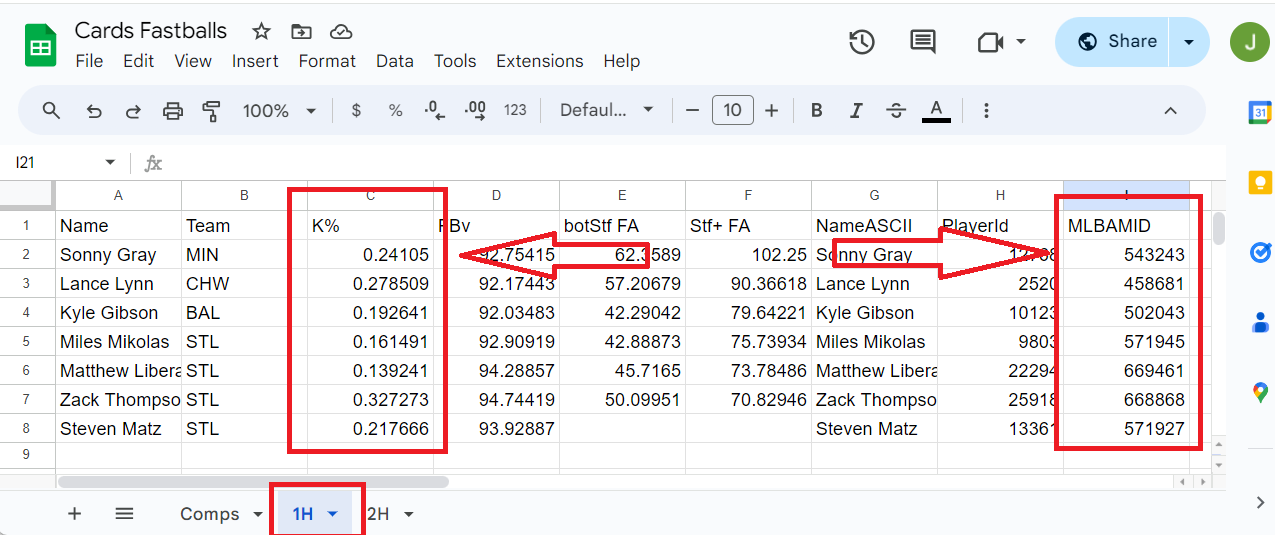
The XLOOKUP command is looking for the contents of C16 (543243) in column I of sheet 1H and returning the corresponding value in column C.
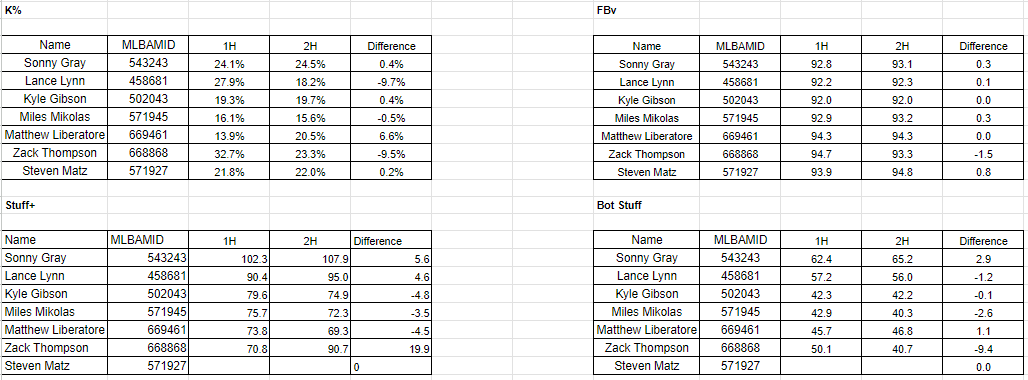
Step 7. Bring in all the stats and find the first-half to second-half differences for each of the pitchers.
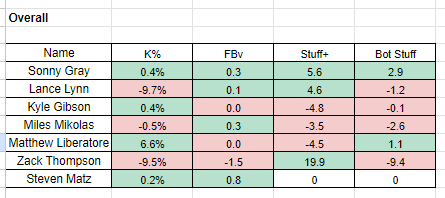
Step 8. Compare all the differences in one table. In this instance, I just linked the cells, but if the table is large, XLOOKUP could be used again.
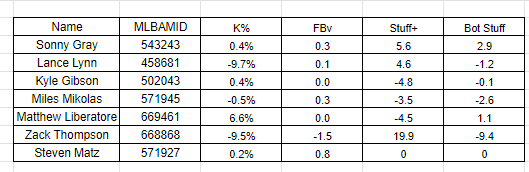
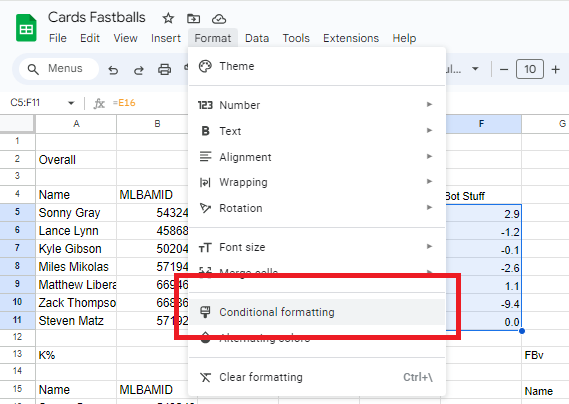
Step 9. Make the table all pretty. Open Conditional Formatting …
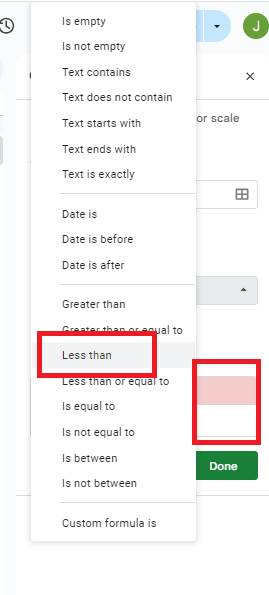
… and set the positive values to green and the negative ones to red.
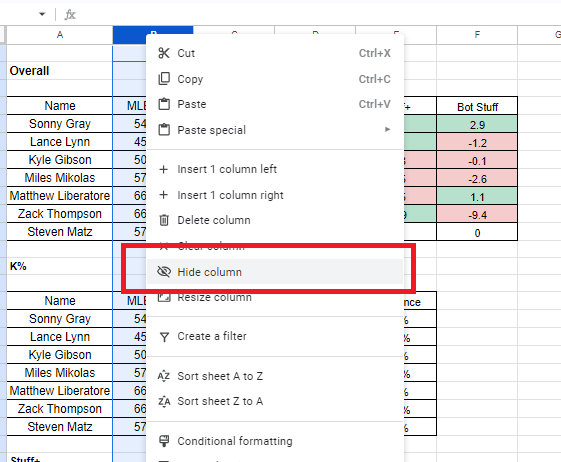
Step 10. Hide the ID numbers.
Step 11. Enjoy the fruits of your labor.